

|
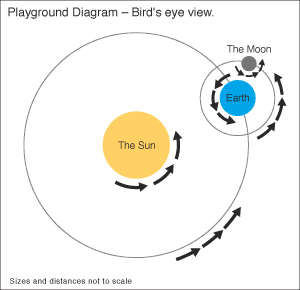
By Keith Wilson Introduction Earth’s Moon Does Not Orbit as Most Suppose. The Moon Does Not Revolve Around the Earth. This evidence shows how standard science often misleads, even on the most elementary subjects, and does not always clear up its “non-truths”. This evidence also indicates that the theory of the moon’s birth being caused by an Earth impact by a Mar’s size object is the one most likely correct. If such an impact occurred it may well have left evidence at the a) impact site, b) the antipode, and c) the equatorial region to impact. These are clearly found and further dispel the Plate Tectonic theory that these “evidence” areas would have been “subducted” previously. True Lunar Orbit Humans learn primarily from what they are taught. Suppose one is taught “science facts” that are obviously wrong? We will, of course, make incorrect future assumptions. Surely, as new evidence comes in, the scientific community would make great efforts in correcting the teaching literature, wouldn’t they? History shows that’s not always true. But this is not about something as complicated as Plate Tectonics Theory where alternatives are neither simple nor obvious. It is instead about something so very simple and obvious that everyone knows and espouses its truth. Something so obvious that virtually all learned man would state a belief such as “The moon revolves around the earth”. But the moon does not revolve around the earth. The real facts should not be ignored, nor quietly mentioned, but shouted out for all to hear as there are vital implications. And so it is shouted out. THE MOON DOES NOT REVOLVE AROUND THE EARTH!! It appears to, but does not. And that fact has significant implications. In nearly all standard explanations a lunar orbit is shown as per Fig. 1 or as Fig. 2. These are just general examples. The reader will find consistent and numerous others.
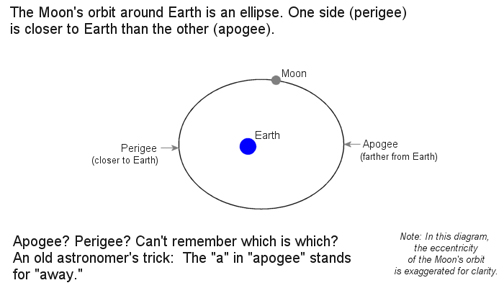
The earth is almost always shown revolving around the sun, and the moon revolving around the earth. Or the moon’s orbit is shown as a slight ellipse since the apogee and perigee is different. All other moon bodies in our solar system do travel around the other planets in this way. All others reverse direction to the overall motion of the planet, as they must, in part of their orbit. But not our Moon. Our moon’s orbit is unique and has been incorrectly taught. Our moon is best described as a sister planet traveling along side the Earth and, like two snakes, intertwine themselves 13 times a year in their mutual orbit around the sun. Both always traveling in the same direction, and never reversing their course. The correct orbit is shown in Fig. 3
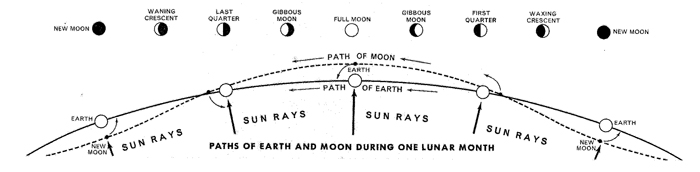
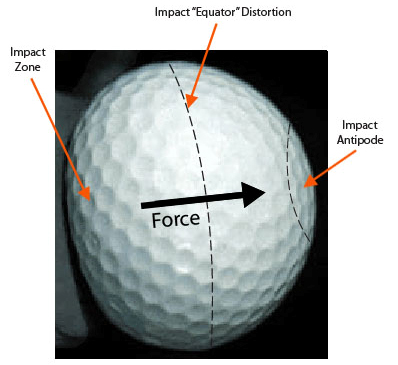
Fig.3 is nearly correct since the scale can’t be totally accurate due to the immense distances involved. In the graphic, the earth’s orbit is shown as always being “convex” to the sun (never concave). This is true. The moon’s true orbit is also always convex to the sun, and never concave. The graphic, however, shows some “concave-ness” in the lunar orbit which is incorrect, but necessary to fit the scale of the page. The moon’s orbit, like the earths, is always convex to the sun and it never reverses direction. This is clearly not what the world has been taught. Since this explanation will be disbelieved by nearly all, these results can be verified with a competent astronomer, or at Wikipedia at: Orbit of the Moon (http://en.wikipedia.org/wiki/Moons_orbit). Scan down toPath of the Earth and Moon Around Sun. A review of 18 Encyclopedic and Astronomy references revealed that only Goode’s Atlas and a college Astronomy text present the orbit correctly. 2 out of 18! All other Atlases and Encyclopedia’s present it incorrectly. Several no longer present any moon orbit information. So nearly everyone believes an untruth and its implications. Lunar Implications For our larger purposes the primary implication of this change in perspective is to reason out how the Moon got to where it is? Numerous possibilities have led to the two remaining primary theories: a) capture or b) impact. (See http://www.lpl.arizona.edu/outreach/origin/) It can be visualized that a wandering body may be gravitationally attracted to another, and through numerous passes obtain a near circular orbit. This is the capture theory, and likely how other planets obtained at least some of their moons. But how could capture cause a near parallel path? It is extremely unlikely. Fortunately, the dominant science theory now is that there was an impact on the early Earth by a Mars size object which threw off crustal mass from the earth. This mass then re-formed as the Moon. Lunar analysis indicates the moon’s age to be about 4 Billion Years. In fact a collision may have been actually with Mars. N Parubets in his article in NCGT #11 (Jun 99) (http://www.ncgt.org/newsletter.php) indicates that earth like crustal rocks were found by Mars Landers, and the moon rocks returned to earth appear to be similar to those found on the earth. So the most significant implication to consider is: Is there physical evidence — on the earth — of a planetary size impact?The rest of this paper deals with that question. A secondary implication of the moon’s orbit of significance to dispel is the mis-belief of lunar gravity attraction. If one believes in the standard revolving lunar orbit one would be led to assume that the lunar movements would be primarily influenced by Earth’s gravity. In reality, with the True Lunar Orbit, the sun actually represents 2/3rds of the gravitational effect on the moon and the earth but 1/3rd. This is significant and noted, but not dealt with further in this article. Mars Size Earth Impact Consider the size and the impact force that would have resulted. There are three potential large scale physical evidence sites to look for:
These two are most obvious, but consider also a third:
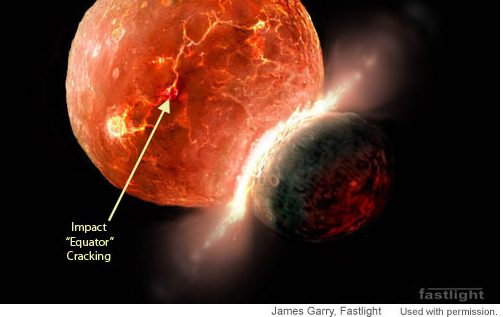
If the solid earth were hit with such a force, it is likely the earth would crack near this equator position and leave residual evidence.
Fig 5 shows a theoretical planetary impact situation. Notice the cracking occurring at the Equator position as (accurately) envisioned by the artist.
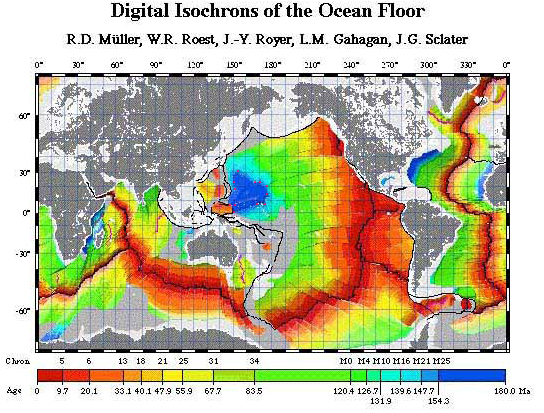
Force, Shock Results If one believes only the Plate Tectonic paradigm, then there is no need to look for impact evidence that may have happened up to 4 Billion years ago (the estimated lunar age). If there were substantial horizontal continental mobility and subduction, the ocean floors would have been recycled many times leaving no impact evidence. Removing the subduction blinders opens the way for new observations. It should be well known that any flat map severely distorts the earth images and so needs. to be compensated for. To do this we need to take physical observation evidence from available flat maps and transfer it to a standard earth globe (12″ diameter, 30cm was chosen) and use precision instruments to measure and plot antipodes and distances. While some may opt for electronic computerized globes, a better alternative is a simple one to hold in your hands. Surprisingly, a globe stand that is a precision tool is not readily available and so one was developed to conduct the following experiment. Age of Ocean Data The floors of the world’s oceans have been dated by science. An explanation is initially needed. During the Plate Tectonic theory revolution, that took place in the decade of the 1960’s; it became known that the oldest part of the Atlantic Ocean was only 180 million years old. This theory clearly expected the Pacific basin to be much older, perhaps billions of years old. This was shockingly not the case, as the oldest ocean floor area in the Pacific was also later found to be only 180 million years. The ocean floor ages were determined primarily with ship borne magnetometers and the evidence compared to known ages. For our purpose, The Digital Isochrons of the Ocean Floor by Mueller, et al, was selected for use because the data and colors were clearly presented and minimized confusion. The age scale was also clearly presented. This is shown in Fig. 6. Further explanatory map information can be found at: http://www.ngdc.noaa.gov/mgg/fliers/96mgg04.html and http://geology.about.com/library/bl/maps/blseafloorage.htm A similar UNESCO map uses core drillings to determine rock types and age. It can be clearly seen in the graphic that the vast majority of the oceans floor is younger than 125 Million years. Only the blue areas are older. The very darkest blue regions are estimated to be up to 180 million years old. This does not seemingly correlate well to the 4 billion years of the likely Moon’s age. How come? A reason for this is that an impact could have occurred anytime before 180 million years if the sediment lay down and magnetic reversals were only captured after the 180 million year period. (A concept consistent with Earth Expansion (EE) Theory). This would indicate a very long period of relative non-mobility for the earth’s surface before continental mobility accelerated at an increasing rate (consistent with EE accelerating expansion). The oldest age shown is 180 million years with a large potential impact site being in the western pacific (dark blue area). The blue grid lines were added electronically so that a precise Latitude and Longitude Grid could be seen which would allow for the accurate transfer of data to the 12″ globe. The 12 red points (Fig.6) were also electronically added to accentuate and make clear the exact outlines of the large dark blue western Pacific oldest age zone. A George Cram Imperial Relief globe was used to capture the transferred ocean age data.
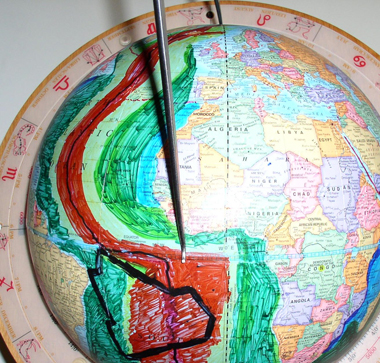
All of the data was transferred to the globe, but only the relevant graphics will be presented. Fig. 7, with the transferred data, shows both the large size of the dark blue oldest markings and the also the odd arrow-head like shape of this blue zone. 1) Impact Zone Possibility: The Pacific basin has long had high potential as a source of the moon, going back at least to Darwin’s son, George, in the 1800’s. Figure 7 shows the plot of the data onto the globe focusing on the Pacific Basin. It can be seen from Fig. 6 that the dark blue area has a specific shape, was marked with the 12 red dots, and whose true shape becomes much clearer when plotted on a globe. Let us call the dark blue area the potential Point of Impact. The younger Pacific Ocean ages can be seen in Fig. 6 to propagate in a near circular fashion. from this Point of Impact.
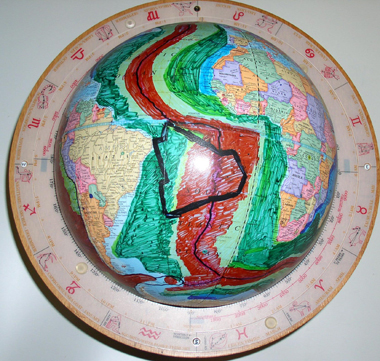
2) Antipode Reaction Site: Using the globe stand we can quickly plot antipode points. We want to exactly find the antipode of each of the 12 clearly defined points marked on the dark blue oldest part of the ocean data. Doing so reveals the shocking and revealing black outlined shape shown in Fig. 8.
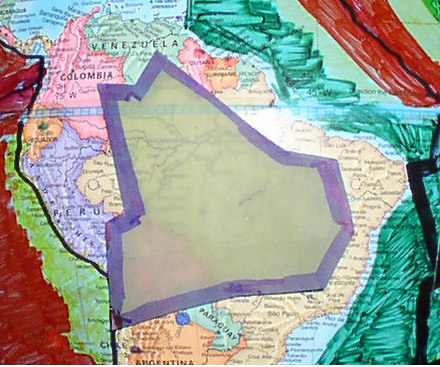
This suggests that the “jigsaw puzzle shape” found between continents in the Atlantic may well have been first caused by an initial cracking eons earlier from a Mars size impact. Assuming South America nestled against Africa at the site of the antipodal impact zone (consistent with both Plate Tectonic and Expanding Earth modeling), then it should be noted that the antipode outline is somewhat smaller than the shape of northern South America (10-20% smaller). This can be seen by superimposing the antipode shape onto the South American continent as shown in Fig. 9. A surface size increase would be expected as the central core of the earth should deflect and enlarge the antipode force lines. However, the current size of the core should have deflected the forces much more significantly, and leads to further research as to what size earth / what size core combinations were potentially possible (not further covered in this article). It would lead one to theorize about a smaller earlier earth and smaller earlier core.
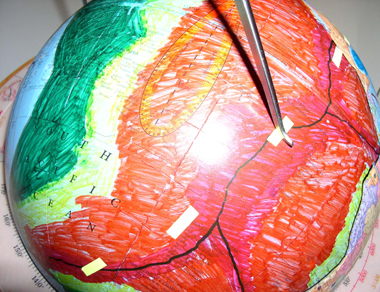
3) Equatorial Region Impact Findings: For clarity and added visibility a large caliper instrument was used for measurement. Fig. 10 shows that the caliper was set to the earth’s equatorial dimension from the North Pole with the caliper’s curved points being precise from the current pole and the current equator. With the caliper set to an “equator” dimension we can use it to measure from the potential point of impact.
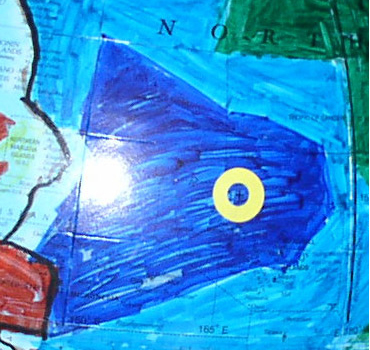
With some experimentation, the yellow circle was placed in the “Point of Impact” to more exactly measure from. It is centered at 16º North Latitude, 166.5º East Longitude. Fig 11 shows this placement from which the caliper measurements are taken. (Same Globe as before. Color difference due to lighting only).
From this initial yellow circle position the 4 visible yellow tape markers were placed by the same caliper action. Notice how all 4 closely align with and follow the Pacific MOR. In the north the markings run into the North American end to the MOR, as if this land mass stopped the crack propagation. Further to the South (out of the picture) the exact crack correlation also ends near Australia. This indicates that there is a 90º near perfect equator crack system from the potential Point of Impact. This would tend to indicate that if the cause were a Mars size object collision, then the object may well have approached from the Arabian Sea near Karachi, Pakistan and struck a glancing blow of perhaps 30º to the earth. It appears to have left an: 1) Impact Zone, 2) An Antipode Reaction Site, and 3) Equatorial Cracking evidence. Future Earth tectonics could then extend the cracks in a fashion similar to an initially cracked windshield. Conclusions Understanding the true lunar orbit indicates that science is not always sufficiently self correcting, as it has not been in teaching this important subject. One should be cautious of the foundations of all assumptions made from even seemingly obvious taught subjects A Mars size impact with the earth is the most likely source of the moon. The moon travels as a sister planet with the earth on a near parallel path. It does not revolve around the earth as commonly believed, and thus its “capture” would have been highly unlikely. If a Mars size object struck the earth there would be initial surface cracking. This paper presents still visible evidence of an impact zone, an antipode zone, and residual cracking at the impacts equator position. The evidence would indicate that if the earth surface were molten at time of impact and/or if plate tectonics forces actually subducted or significantly moved these areas a number of times, then these evidence features should not be visible. But they are clearly visible. This is further evidence that the Plate Tectonic theory and the early molten earth theories should be reviewed. The evidence in the Atlantic indicates an initial antipode reaction crack formed. From this crack, mobility between the African and South American continents then occurred over time forcing them apart. This mobility could perhaps be from Plate Tectonic Theory of continental horizontal mobility, or from Earth Expansion Theory of continental vertical mobility. (See Article 2: An Ockham Razor Expanding Globe Experiment as an example of vertical mobility between South America and Africa.) This impact evidence is consistent with the Earth Expansion Theory that continental mobility has been caused by vertical increases in earth radius. The Digital Isochron age data (coloration showing more surface area accumulation in more recent times) indicates that earth radius and surface area has been increasing at an increasing rate. Other interpretations may be available and this paper is presented for such discussion. |
The True Lunar Orbit, New Mars Size Impact Evidence, and Earth Expansion Implications

About admin
Subscribe
Subscribe to our e-mail newsletter to receive updates.

Comments are closed.