

|
By Keith Wilson, September, 2011 It is worthwhile to first review previous evidence. The new findings are below under the “Solar Evidence” section. Great Circles and 4 Connecting Points. There is additional evidence that can direct us to the causes of Earth Expansion. In previous work it has been shown that numerous continental edges, or lineaments, can have Great Circles (GC’s) drawn down them on a sphere and these will connect to four (4) unique points on the earth’s surface. As previously explained, the location of these 4 points provide the initial clue that expansion is first related to the Earth’s Magnetic Core since two of these points are antipodal and are near the Earth’s Magnetic North and South Poles. Secondly, the other two points are also antipodal and are located precisely on the Tropics of Cancer and Capricorn. This indicates influence from the Sun, Earth’s transit in its yearly orbit, and its 23.5º axis tilt. This has been called MACO-SPIRE, MAgnetic COre, and Solar Plane Induced Reactive Expansion. The graphics that define the four points and the connecting 3 dozen or so GC’s can be found at http://eearthk.com/Expand.html#t21 . For easy reference, shown are the four points with some of the Red GC lines that identified them.
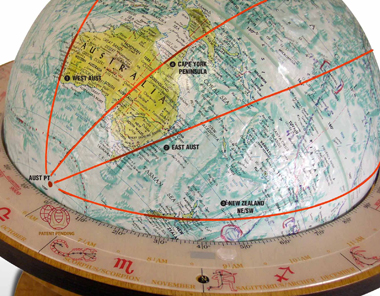
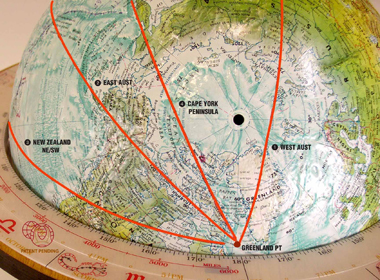
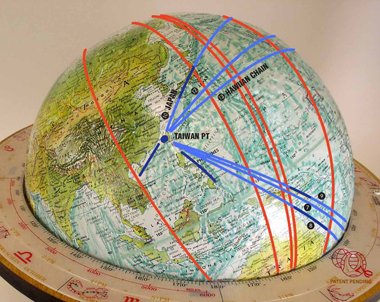
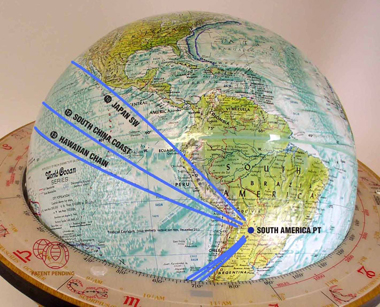
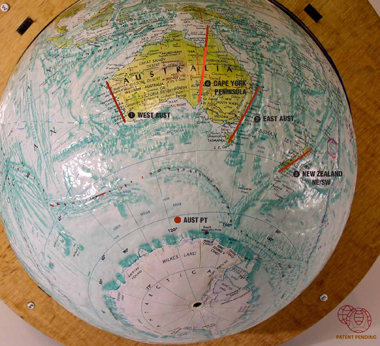
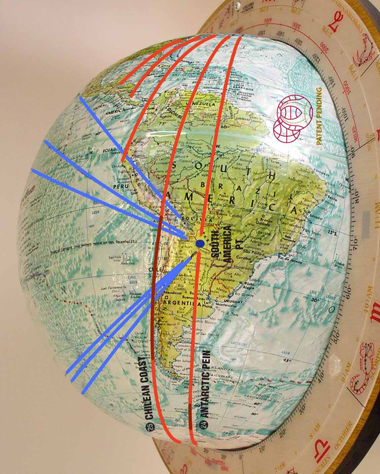
As can be seen in Fig 1a, GC’s drawn down the Coasts of Australia 1) West Coast, 2) East Coast, 3) New Zealand’s South Island, and 4) Cape York Peninsula, initially identify the Australia Pt. Continuing these GC’s around the globe in Fig 1b shows them reconnecting at the antipode Greenland Pt. Fig 2a identifies the Taiwan Pt. Fig 2b identifies its antipode, the South America Pt.
Continental Reshaping. A less obvious observation is that the continental edges are likely being reshaped in harmony with expansion. The GC evidence indicates that during expansion, the 4 points on the Earth remain relatively fixed, and as the Earth Expands – and the continents expand away from those points – the continents are being reshaped to maintain the GC connection.
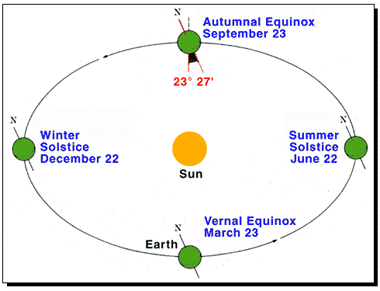
Solstice Evidence for an Expansion Controlling Influence. This section will provide new evidence that the sun’s emissions are a, or perhaps the, most significant influence on expansion. It is necessary to more fully explain the influence of Earth’s orbit and tilt in understanding this evidence.
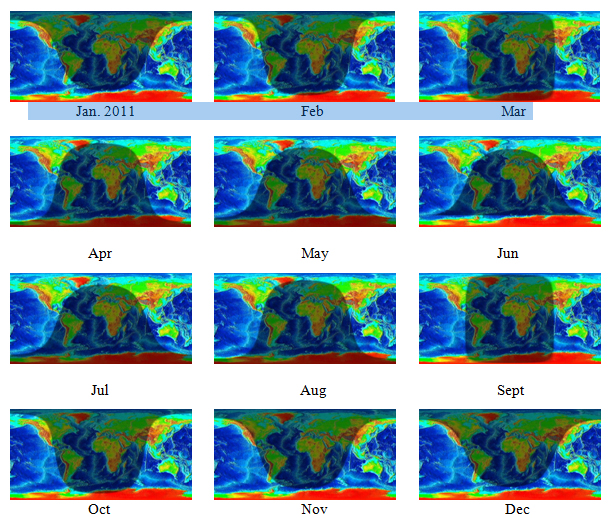
What does Solstice really mean? It means Sun Still. Why is this relevant? There have been thousands – not just a few – of ancient observatories built, of which Stonehenge is perhaps best known. For these observatories it would be most important to know where the Spring and Vernal Equinox occurred. Surprisingly, this location cannot be done directly, or easily. The equinox dawn arises due East. Where is due east to an ancient without GPS or a compass? The sun’s rising at dawn does not mark due east easily, because when it is in the vicinity of due east it rises perhaps 1/2º further in its course North or South per day. It transits East very quickly. That may not seem like much, but the sun and moon are each also 1/2º wide, for reference. Which day is correct? Not easily known. . So how did the ancients mark the key dates? They marked the Solstice dates first and then worked back to the Equinox. They did this because when the Sun approached a Summer or Winter Solstice date, the Sun slowed down in its movement on the horizon and finally Stood Still for several days. Then the ancient’s could mark it with two aligned stones. So for comparison, at equinox there are about 4 days when the Sun is within 1º of the “due east” point. At Solstice there are about 30 days when the Sun is within 1º of the Solstice position. So it is easier to mark those two stones. For our purposes, if the sun is “painting” the earth with some force primarily active at dawn and dusk it will have nearly 10 times more effect – nearly a magnitude – at the Solstice position versus the Equinox position and other dates. What this means is that if there are 365 days a year, some days and thus some locations have a significantly greater number of consistent Great Circles of dawn and dusk sun angles then do others. The graphic evidence to be presented next is that it appears that whatever and whenever the sun emits, its effect on the earth appears to be optimized at dawn and dusk. The Sun is not a constant emitter. It goes through a cycle of numerous divergent phases, the 11.1 year sun spot cycle being the most well known. But there are a number of different positive (+) and negative (-) charges emitted by the sun in addition to its cosmic rays. So we are not dealing with a consistently constant force. There are also indications that there are significant atmospheric changes on Earth at dawn and dusk and these also need to be considered, in future research. Dawn and Dusk by Month on a Flat Map Projection. A sphere of course works most accurately, but we have available through www.fourmilab.ch the ability to see sun angles on Earth throughout the year, of any year, and any specific time. To get visually grounded, here are 12 small graphics that show how the GC of Dawn and Dusk changes on a flat map projection throughout the year. These also indicate how a Great Circle would plot on a sphere. They are for 2011, on the 21st day of each month.
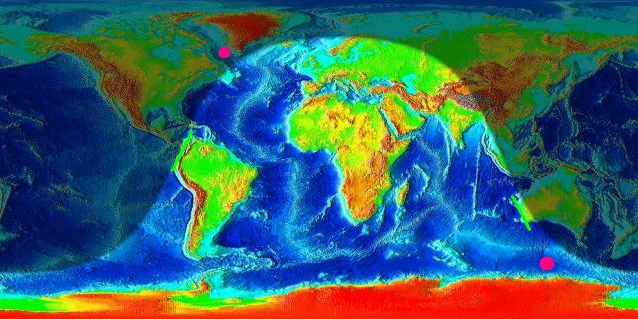
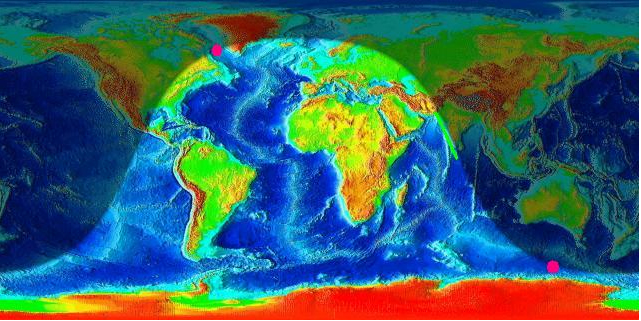
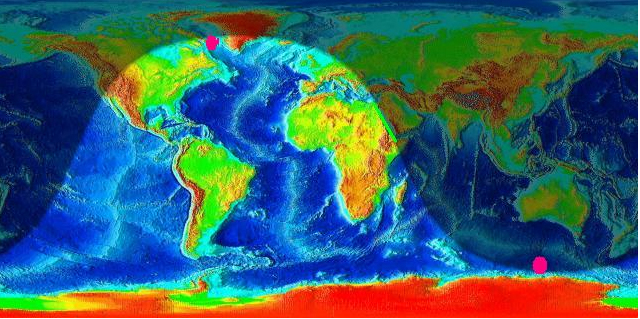
Solstice Dawn/Dusk GC to Previous GC Alignments. Now we can plot these dawns and dusk markings on a number of previously identified GC’s that connected to the Australia and Greenland Pts. A red circle marks the approximate pts. A bright green line highlights the relevant coastal lineament.
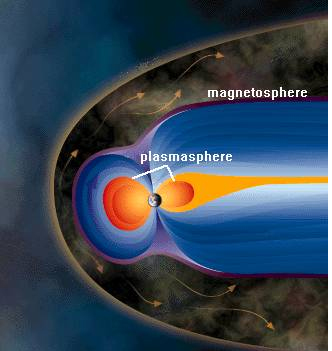
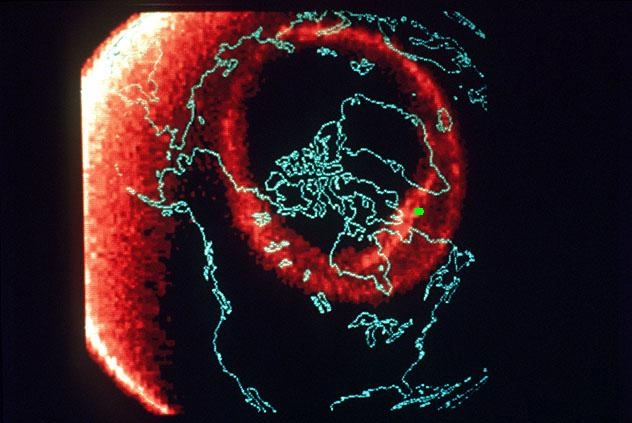
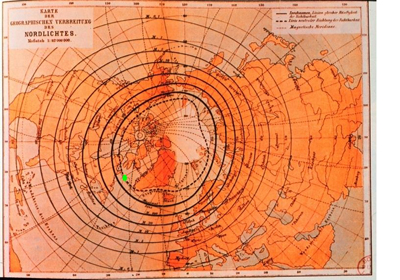
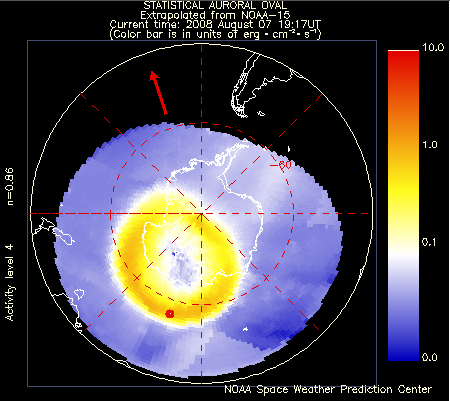
The reader can develop many more graphics from the Fourmilab site that corresponds to these figures. The evidence indicates that at dawn and dusk the Sun is affecting the earth in special ways. This effect or “paint” effect is multiplied at the Solstice, when the same curves occur for about 30 days and perhaps overpowers the “paint” effect on less consistent days. It is not clear whether the effect is daily or only occurs when certain types of Sun emissions occur. Are there other Electromagnetic (EM) effects that correlate with the Australia and Greenland Pt.? Well, yes. Electromagnetic Aurora Effects. The Sun’s emissions and the Earth’s Magnetic field interact as shown in Fig 9. This effect is not constant but depends on the Sun’s Cosmic Ray strength and the strength of the Earth’s Magnetic Field.
The following 3 Figures mark in a bright color dot the location of the northern Greenland Pt, and the southern Australia Pt.
Conclusions:
Correlation is not proof of Causation. Neither should it be ignored as pure Coincidence. Further pursuit of this evidence continues to open new doors. As Richard Feynman said: “You know you are onto something when you put in a quarter and get $2 in change.” Future articles lead into the emissions from the sun. Some of which are the small elemental parts of the most abundant element in the Universe . . . Hydrogen. |
Earth Expansion Causal Evidence Continental Shape Shift and the Solstice Correlation
About admin
Subscribe
Subscribe to our e-mail newsletter to receive updates.

Comments are closed.