

A Better Alternative to Plate Tectonics
|
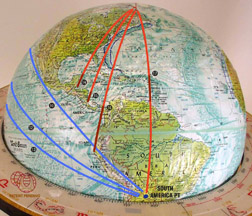
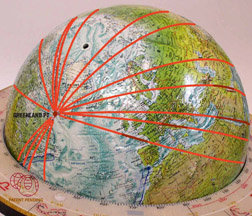
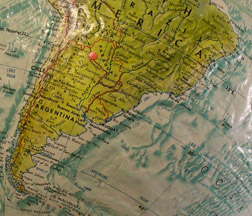
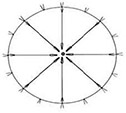
What are these lines that connect a point near
Greenland to a point south of Australia? |
|||
 |
|
||
 |
 |
||
|
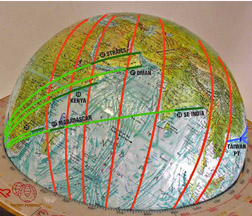
They are Great Circles tracing major Earth Features |
|||
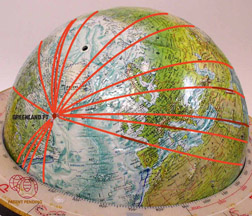
Plate Tectonics is the only Earth Science theory that is taught in schools today. There is another well thought out theory that better and more simply explains the facts and evidence found in Geology as to how the Earth developed. It is the Expanding Earth (EE) Theory. The implications of the EE Theory are so profound and alter 50 years of science theory that it has met the fate of being ridiculed and ignored. There are a number of scientists studying these phenomena, mostly outside the United States scientific community. The evidence is growing, getting more precise, more visual and more difficult to ignore. This site will explore new evidence of expansion and its cause. We will make a brief introduction to the EE Theory, and then focus on the graphics of drawing Great Circles on a 12″ globe. These lines connect and provide clear evidence of not just growth from within but the cause of that growth. A 12″ Globe, the Globe Stand and marker pens are all that’s necessary to replicate these extraordinary scientific “experiments”, even at home.
|
The best overall book to read about the Expanding Earth is: Theories of The Earth and Universe: A History of Dogma in the Earth Sciences, by S. Warren Carey, 1988. Stanford University Press. I would also recommend a new book by Dr. James Maxlow in Australia, Terra non Firma Earth, Plate Tectonics is a Myth. Dr. Maxlow has produced the finest globe reconstructions on a smaller size Earth and has done extensive scientific work on this subject. The e-book can be found at: http://www.oneoffpublishing.com/terranon.html I would highly recommend the following new animated graphics by Neal Adams showing expansion on the Earth, Moon, Europa and others along with other information at Visit our Recommended Readings page for other good links to websites and book resources. |
Introduction
 |
The picture at the left is often used to show how our perception is directed to see one thing and then, forevermore, we see it and disregard all evidence to the contrary. Do you see a young women or an old lady? They are both there. The teaching of Plate Tectonics is similar. There are two pictures visible from the hard facts. One has become dogma, and the other ignored. EE is new and offers challenges and opportunities not imagined. In the picture both ladies face to the right. The nose of the old lady is the chin of the young women. The mouth of the old is the necklace of the young.
The Earth is not of constant size, but is expanding. For comprehension and memory, numbers have been simplified. The Earth’s radius is increasing about 1″ per year. The Earth has been expanding for over 250 million years and so has approximately doubled in radius size. The rate of growth over that time is exponential and is increasing at an increasing rate. This indicates today a diameter increase of about 2″ per year, a circumference increase of 6″/yr, an ocean floor area increase of about 1.5 mi² /yr, a volume increase of about 3,100 mi³/yr, and a gain of mass of about 7,875 Billion tons per year. 70% of the growth is in the Southern hemisphere and then redistributed around the globe. This would indicate a gravity 250 million years ago of about 50% of today’s. While these numbers seem initially unimaginable, the Earth’s size is so immense that expansion is nearly undetectable. It would take nearly 10 million years at those rates to increase the Earth’s radius and circumference by 4%, while surface area would increase 8%, and volume and mass by 12%, in that same time. But it is these forces, which contribute to, if not cause, ice ages, earthquakes and super volcanoes, massive lava flows, tsunamis and historic catastrophic disasters and earth shape changes.
It will be shown that the Earth is predictably expanding around force lines that can be plotted with Great Circles around an Earth sphere. This is a new discovery and patents have been granted. While not proving causality, the evidence of these force lines will show, 1) a close correlation to the Earth’s magnetic poles, and 2) a close correlation with the Solar Plane’s perpendicular energy at the Tropic of Cancer and the Tropic of Capricorn at 23.5º North and South latitudes. It will also provide new and different insights into hotspots like the Hawaiian island chain, and island arcs such as in Japan, New Zealand and the Philippines. These findings also help show how the earth continents fit back together on a much smaller sized sphere.
Final Implications: Keep an open mind, if but for a little while. Consider the implications. Mass is being gained and can be proven with Earth studies. Are other planets and suns now gaining mass? How? Gravity has been increasing and the size of animal life has gone from gigantic to today’s smaller size. What are the implications for evolutionary studies? The Earth is expanding in size. The north and south Polar Regions are thereby getting enlarged and contribute to of ice age cause. If new mass is being created, are all useful minerals really limited to what was here on earth 4.5 billion years ago? Was the Chicxulub meteor impact — believed to have ended the dinosaur reign 65 million years ago — really a meteor collision or a super volcano as some in the EE community believe? If electro-magnetic energy is implicated as those in the alternate physics and alternate astronomy community indicate, do we have a new source of limitless power available to us?
What is truly astounding is that we have the tools currently available to prove the above. Nothing new needs be invented. Plate Tectonics is a falsifiable premise in accordance with Karl Popper’s views. The tests of re-measuring the earth can be done but the science community has not wanted to run the tests and to review old data. The implications are too far reaching.
A great debt is owed to Dr. S. Warren Carey from Australia who was a pioneer and fought for over 50 years to teach the Expanding Earth Theory.
First, a brief summation of 100 years of history of geology, for perspective. The brain has room to hear, understand and store many theories, without accepting them initially. History has shown that often a discredited and discarded observation has become the new foundation stone of science.
Earth Expansion: The Earth is not of constant size, but is expanding in radius about 1″ per year. The Earth has been expanding for over 250 million years and so has approximately doubled in radius size. The Earth’s mass has increased and gravity has increased over this time. This is not new knowledge but it hasn’t been widely taught. Sam Carey — the outsider, but brilliant geologist, from Australia — taught this for over 50 years, with limited recognition until he died in 2002.
At the turn of the 20th Century (1900’s) there were three (3) main theories to explain the Earth’s major features such as oceans and mountain ranges. They were the: 1) Constant Size Earth, the 2) Contracting Earth, and the 3) Expanding Earth. With few facts and mostly opinion and assumptions the Constant Size Earth theory became dogma to the exclusion of the others.
Also at the turn of the 20th century, again there were two (2) competing theories, this time to explain the location of continents and the location of fossils. The believers of the two theories were the: 1) Fixists, and the 2) Mobilists. As the names indicate, scientists either thought that the continents were “fixed” in place and immoveable, or that they had “moved” throughout time. The Fixists then dominated and ridiculed the Mobilists, as in, “What force could possibly move the continents”! Most scientists then believed in the combination of possibilities to be a Constant size Earth, with Fixed Continents. That was the dominant perception.
Many know that in the 1912 Alfred Wegener wrote and lectured about Continental Displacement, which was demeaned and referred to as Continental Drift. His work was not accepted until well after his death in 1932. Most scientists didn’t accept his findings until new irrefutable knowledge was gained in the 1960’s.
|
|
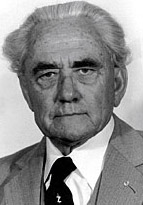
Plate Tectonic theory holds that the continents move apart horizontally, sliding in different directions over the Earth’s crust.
|
|
|
Plate Tectonic Theory: Continents have been moving horizontally apart.
|
These blue Earth reconstructions are standard with Plate Tectonics. We know the present one is accurate because we can see it. The others are not certain.
 |
 |
|
Bullard Fit
|
Teeter Totter
|
The earlier reconstructions were done because it was most obvious how the Atlantic continents fit together. This is known as the famous Plate Tectonic “Bullard Fit” (EC “Teddy” Bullard, Cambridge Univ.). It fits together the most obvious Atlantic continents. But it eliminates the Caribbean, Central America and most of Mexico — indicating stretching apart had to occur. Once you assume the ancient earth was the same size as today, like a Teeter-Totter, when you force one “Teeter” seat to touch the earth as in the Atlantic Bullard fit, you naturally get a large expansion between the lands on the Pacific “Totter” side of the ocean. This caused the assumed opening on the other side of the Earth called the Tethys Ocean. It never happened. It was an inland sea.
Once you realize the earth has been expanding, the continental pieces fit back together nicely on a smaller earth as shown by Carey, Hilgenberg, Vogel and others and most recently from the work of Dr. James Maxlow of Terrella Consultants.

Good science work has also been done on the magnetic fields of minerals (called paleomagnetics) to show movements and supposedly how continents fit back together. It is said to confirm Plate Tectonics. Not true. This magnetic work can also be read either for a Constant size or an Expanding Earth. Like the old lady and the Teeter-Totter, the good magnetic science work has been force squeezed into only one viewpoint. There is an alternate and more accurate explanation.
Thus, the apparent truth of Plate Tectonics has a clear and distinct competitive theory. As the Earth has expanded the continents have mostly held their primary positions, but have moved vertically away from the Earth’s growing core. The effect on a greatly expanded Earth circumference is a moving apart of continents – but due to a vertical movement. The visual effect looks like a horizontal movement.
Mid-Ocean ridges are expansion joints on an expanding sphere. Like a cracked egg with lava flowing out the seams and forming the ocean basins, the ridges show where the cracks were opened and how fast the earth split apart, and when. Age dating now is sufficiently advanced and widely available to clearly show the age of creation of the spreading ocean floors.
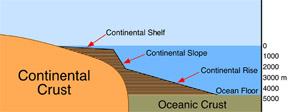
Ocean floor composition, thickness, and age can be accurately determined with core samples and are distinctly different in all three categories from the landmasses on continents.
 |
|
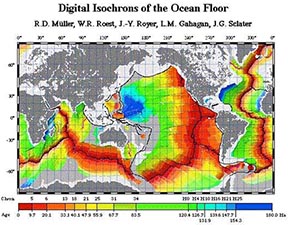
Digital Isochrons of Ocean Floor
|
In the 1960’s conclusive proof showed that mid-ocean ridges existed and extended for over 40,000 miles around the earth, with lava flowing in both directions, from these expansion seams.
The data showed that these ridges were volcanic and that new ocean crust was forming and being pushed away to both sides of the ridge, apparently pushing the continents apart. In the map, color indicates the ocean floor age. The red color is the newest formed ocean crust expanding on both sides of the dark ridgeline. This data was limited until completed in the 70’s and 80’s.
The discovery of these expansion ridges was a catastrophic occurrence (but irrefutable) for those scientists who had been adamant “Fixists”. Consensus shifted to Mobile Continents in 1963-65. Worse, one of the discoverers of these ridges — Bruce Heezen — stated his belief that — everything being considered — the cause was due to Earth Expansion. This was another brutal affront to “Fixists” and those who believed in “Constant Size Earth”, and they fought back.
 |
|
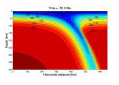
Descending Chute
|
In the 1960’s other explanations were sought and the theory of Subduction zones was quickly developed and published in 1967. With very limited data, and in near historic speed, the theory of Subduction became widely accepted among scientists. This kept the Constant Size Earth theory widely accepted, (but on shaky foundations). Subduction states that as new ocean crust is created (Expanding the Earth), other ocean crust is funneled down a chute or escalator type system in deep unseen ocean trenches to be remelted and used again, keeping the Earth at a constant size. Often shown as a simple, 2 dimension descending chute for graphic effect, there is no open mouth chute. That the lighter less dense crust must descend into the heavier, denser than granite mantle, does not seem to matter.
Many of the documented facts leading to the Plate Tectonic theory are held by the Expansionist camp, but Subduction theory is widely disputed. All “proofs” of subduction are inferred, or based on secondary evidence. There are no “direct” proofs. (defined as an object actually being subducted, directly, seen or measure, or land features physically measured getting closer together.) No experimental objects have been placed, with subduction measured. The earth has been accurately measured but once — not two or three times. And yes, there is an explanation for apparent GPS evidence. The all-important GPS math formulas build in an assumed constant size and mass earth.
Those who believe in Earth Expansion have had many hurdles placed in their way. One major hurdle can be stated as the need to prove a mechanism for expansion, not just to postulate and show it has occurred. The postulated primary cause of Earth Expansion is the creation of new matter or mass or, in some unknown way, the capture of matter in the Earth’s interior. Since the science of Physics currently believes all mass was in existence at the beginning of the Universe and at the initial explosion called the Big Bang, then expansion geologists would also have to overcome the objections of physicists before they could have their full day in court or the classroom. These are hurdles not encountered if you hold a belief in the standard science theories. Please see, The Big Bang Theory Lacks Common Sense Article, click here.
Within the Expanding Earth belief community there is not yet a consensus on growth causes, and there shouldn’t be. Debate leads to truth. There are currently four (4) primarily stated causal hypothesis to expansion:
Table 1. Causal Hypothesis to Expansion
| 1 | Accretion of dust particles from space, perhaps at far greater rates than of today. |
| 2 | A change in the ″G-gravity constant″ over time leading to general expansion in the universe. |
| 3 | A “Phase Change” in the Density of the earth over time, from small and dense to larger and lighter but all with the same mass.. |
| 4 | An actual increase in the mass of Earth, probably in the core or the core mantle interface. Either a ″capture″ or retention of unknown particles or energy, or the actual creation of new mass from some unknown method. |
The primary reasons for doubt about hypothesis 4 — an increase in mass — (even within the EE community) is that it is unsupported by the current beliefs in Physics and mentally many just can’t get their minds around it being possible. The two greatest theorists of Expanding Earth were Sam Carey, and Ott Hilgenberg (now both deceased). Both believed in hypothesis 4 — the creation or capture of new mass inside the earth. Today’s two living and most published Expansionists (Maxlow and Scalera) state a preference for hypothesis 4. These learned opinions, and other new evidence to be presented here, give hypothesis 4 the highest probability of cause.
Studies on the gigantic size of dinosaur era fossils in relation to a changing gravity are vital but nearly unstudied within the standard science community. A smaller size earth with the same mass would have had a gravity 4 times stronger than today’s. This would not explain dinosaur’s large size and reduction in size over time. A smaller Earth with an increasing mass of 250 Million years ago, however, would potentially have a gravity of about 50% of today’s. Gravity would increase over time as the Earth expanded. This helps explains the huge sizes, the high percentage of bi-pedal gaits, blood pressure systems needed, and the dominance for so long of the dinosaurs. As gravity progressively increased, their size decreased, as did the size of plants and insects. A lower gravity helps explain how huge pterodactyls and dragonflies could fly.
65 Million Years ago the Dinosaurs died out and at the same time the Earth has come to be continuously colder, until today. An increasing size Earth helps explain these temperature changes with increasing polar region sizes.
|
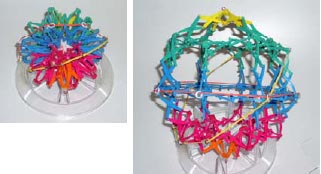
The Hoberman sphere expands from 6″ to a sphere of 12″ and can be used to visualize Earth Expansion. |
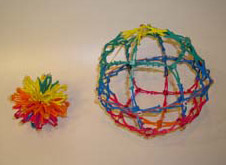
This 12″ is exactly the size globe we are using and its smaller 6″ size is useful in understanding how a smaller earth has expanded over 250 million years to its present size. This ingeniously designed ″toy″ provides thoughtful insights.
We will move to an attachment at this point to show an interesting ″crucial″ experiment using the Hoberman sphere. See An Ockham Razor Expanding Globe Experiment Article, click here.
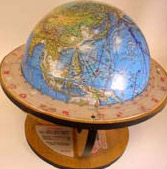
Globe Stand, Great Circles, and the Expanding Earth
 |
|
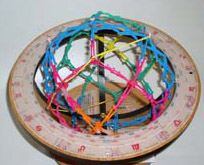
Expanding Earth Knowledge
Globe Stand |
Why is a Globe and Stand useful for Expanding Earth understanding? A well-constructed relief globe that shows undersea features is highly accurate and is necessary in understanding the Earth. Typical globe stands are for decoration and not useful tools. For our work three tool functions are necessary:
1) Full visibility and accessibility of all parts of the Earth
2) Ability to draw full Great Circles, and
3) Ability to find Antipodes – the opposite side of the Earth.
The Expanding Earth Knowledge Globe Stand does all three and much more.
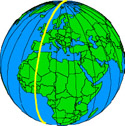
Great Circles:
Great Circles are explained in the 12″ Earthsection and should be reviewed. Great Circles are the largest circumference that can be drawn on a sphere. Any two great circles on a sphere must intersect in two points – one crossing point and the exact opposite antipode point. If these rules don’t occur then you aren’t dealing with Great Circles.
|
As the picture of Longitudes lines show, they are all Great Circles connecting to the poles. Notice that the Great Circles start at a point, begin with a narrow angle apart, move away from each other, reach a point where the lines look parallel, move back towards each other, and finally connect back at the opposite point. The same thing happens to re-orient Earth’s features through expansion, once you know where the expansion “Pole” positions are. There are currently Four Key Points positions and a 5th position from an earlier time. They aren’t marked on any other Globe. We had to find them. Let’s start by finding the two North and South Poles of Earth Expansion. |
Navigating and Finding Positions
|
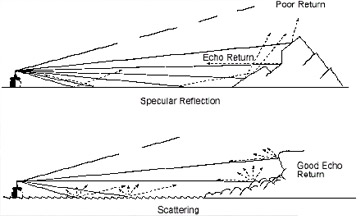
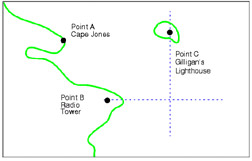
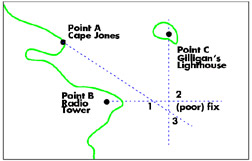
When I was in the US Navy, this was my ship. Among other things I was the Combat Information Center Officer (CICO) and thus controlled the Radar Navigation on a large amphibious vessel. When making beach assaults, my ship and I led a Task Force of four others in fast to anchorage in the dark along unfamiliar coasts. My crew then directed the ship-to-shore beach assault using radar fixes alone. Any mistakes with radar and the mission would go wrong. Being wrong wasn’t an option and so through much mental “chaos” we became very good at reading charts, comparing them to radar “echoes”, and precisely locating our position (GPS wasn’t yet invented). Radar allows taking both Range and Bearing readings. There are two relevant points to be made, that concern the Expanding Earth Theory.
|

|
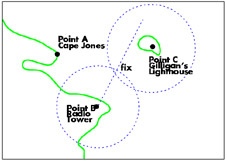
First, radar echoes aren’t perfect and ambiguous readings occur. Hard rock cliffs usually give good readings. Gentle sloping sandy beach echoes “move” with the waves. Ambiguity, (within earth data also) must be accepted and dealt with, to get a sound reading. Second, good navigation fixes depend on more than two points to improve accuracy. There should be good readings from 3 positions or more. Ideally, with separation of 60º – 120°apart. Expanding Earth Key Features have some ambiguity and that’s why we select between the coast, 100 and 1000-fathom readings. There also needs to be multiple positions for accuracy from all quadrants of the Earth that align to Key Points as evidence for expansion. The Key point alignments follow the time tested guidelines for accurate position locations. |
 |
 |
|
Initial 2 Point Fix …
|
can Prove Inaccurate …
|
 |
|
so, Get 3+ Good Ones.
|
Finding Earth Expansion Points
|
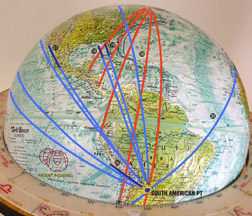
The same technique will be used on all that follows. Short lines were placed on Key Land Features and marked in a dark color by marker by hand. In this case Dark Red. The feature could be the coast of land, or it could be land at 100 fathoms (600 feet), or 1000 fathoms (6000 feet) below the ocean surface. As the continents pulled apart, they stretched like taffy and ripped apart. The Coastline, and 100 and 1000 fathom features have been determined to be most representative for reconstructions by EE scientists. Figures 2a and 2b shows how the coastlines look after they have been pulled apart.
|
 |
 |
|
Fig. 2a Coast Line Separation
|
Fig. 2b Cape Horn – South America – Submerged Coast
|
After the Key Features have been marked, a Great Circle in a lighter shade of color is drawn around the entire globe using the wooden ring. (Non-Permanent wipe-off Markers are excellent for this purpose. Permanent markers were also used.). For better visibility those lines were then electronically traced and enhanced for this website.
 |
 |
|
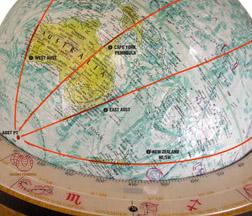
Fig. 3a Australia Great Circles
|
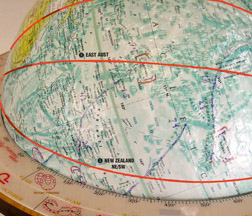
Fig. 3b Mid/Parallel GC
|
 |
|
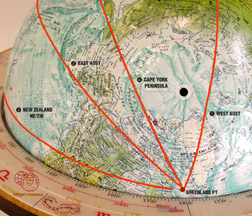
Fig. 3c GC reconnect Point
|
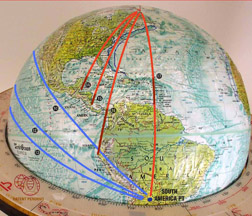
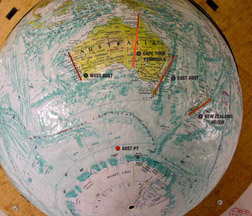
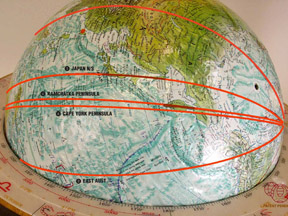
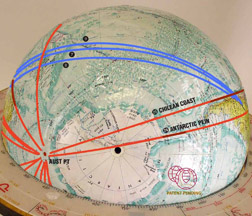
Australia is used as a beginning standard. Light Red is chosen as the color to connect to a point below Australia to a point just west of Greenland. Initially 4 Key Features were identified in Dark Red: #1 West Australia Coast, #2 East Australia Coast, #3 New Zealand – South Islands, and #4 Cape York Peninsula, Australia. Then the Light Red Great Circle lines were drawn on the Dark Red lines. It can be seen from the wood ring that they are Great Circles. Since they are all Great Circles they had to reconnect at some other point. The antipode is west of Greenland. Selection of the Key Features is important, the rest is just mechanical. Clicking on the pictures enlarges them. A total of 49 Key Features are listed here.
The above 4 features seem to point to a position point south of Australia. Four features could be just a coincidence so we have to look for more to fix that position.
Australia and Greenland Points
 |
<
 |
|
Fig. 3d Add Kamchatka and N. Japan
|
Fig. 3e Connect GC, Add Dark Blue
|
In Fig. 3d we mark two more reference points in dark red between the already drawn GC lines. These are the #6 Kamchatka Peninsula, and the #7 North Islands of Japan. Not only do these features align in GC’s to our two key points but also they show other useful evidence. An enlargement shows how the Kamchatka peninsula fits back into the coast of China before expansion pushed it out. In the case of Japan, while PT calls it an Island “Arc” it is really an extended island chain being expanded outwards. Fig. 3e shows how those two reference points connect to the Australia Pt.
Dark Blue lines are now added to mark the Key Features of #7 New Zealand – North Islands, and the #8 Northeast Coasts of Australia and #9 NE New Guinea Coast. These will connect to the other two points to be discussed, and we will use Light Blue for consistency with those other two points.
 |
 |
|
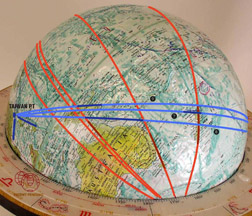
Fig. 3f Taiwan Point
|
Fig. 3g Taiwan Point GC
|
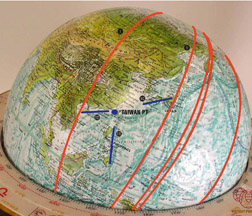
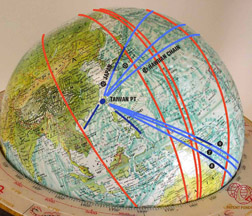
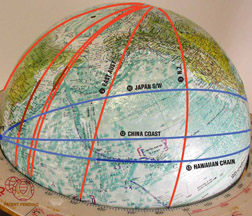
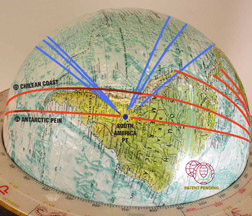
Dark Blue lines now mark the #10 South Japanese Islands, #12 South China’s Coast and the #11 Philippines Trench in Fig. 3f. Great Circles are drawn in Light Blue on these lines in Fig. 3g. The Philippine line is left for you to draw and see that it too connects to the opposite – antipode – point. A very interesting Light Blue GC line through the #13 Hawaiian Island Chain is also drawn.
 |
 |
|
Fig. 3h Taiwan GC North
|
Fig. 3i Taiwan GC South
|
Great Circles take getting used to if you haven’t used them before. In 3h we plot Great Circle lines going north from the Taiwan Point. The #10 South Japanese Islands’ GC route can be seen to almost parallel the west coast of Mexico, and the #13 Hawaiian Island Chain GC does connect to the Taiwan Point. When we take the southern route on 3i it does not look possible for the two GC routes — North and South — to possibly connect. Well (Fig. 3j) . . . Bingo! That’s why they need to be drawn.
 |
 |
|
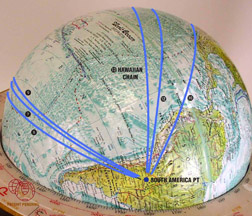
Fig. 3j South America GC Connect
|
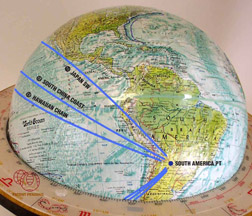
Fig. 3k South America Rotated North
|
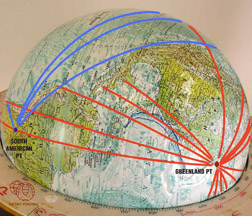
The Taiwan Pt. antipode is the South American Pt. Fig. 3j shows how the southern route and northern great circle routes all converge on the South American Pt. Fig. 3k rotates the globe to give as a view we are more familiar with.
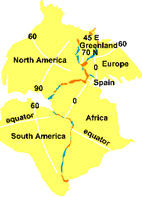
Four Points, Latitude/Longitude Positions
Now that we can start to see these four points, let’s locate them more precisely.
| Point 1 – Australia Point: | 61.5° South Latitude | 122° East Longitude |
| Point 2 – Greenland Point: | 61.5° North Latitude | 058° West Longitude |
| Point 3 – Taiwan Point: | 23.5° North Latitude | 118.5° East Longitude |
| Point 4 – South America Point: | 23.5° South Latitude | 061.5°West Longitude |
Right now these look to just be four normal points. Of increasing interest is that these points plot out to be almost exactly on their own Great Circle and almost exactly 90°apart. What is going on?
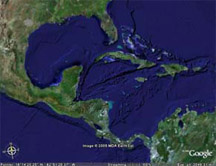
A look at the Caribbean — without thinking about PT — clearly looks like it has been stretched in a south and east direction. South America looks like it rotated clockwise and took the easternmost Caribbean islands with it. Ripped off of Mexico like stair steps were the Yucatan Peninsula and the Nicaraguan Coast. Just randomly or was there some overriding force behind such movements?
| It would be good to have an interactive map available that shows clear subsurface features. We use Google Earth. One can see the taffy like extrusions in the Caribbean that stretched and pulled the region east and then south. Notice the continental drop-off of the Nicaraguan coast is different than the coastline. |
|
|
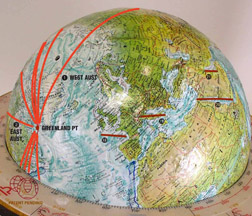
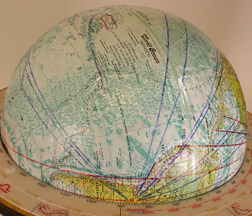
The Dark Red lines added are #14 Yucatan Peninsula, East Coast, #15 Nicaragua East Coast at 1000 Fathoms, #16 the Northwest Coast of South America, and #17 Caribbean Windward Island Chain. It will be noticed that all four new Light Red lines converge on the Greenland Pt and would also converge on the Australian Pt. if that could be seen. More coincidences? |
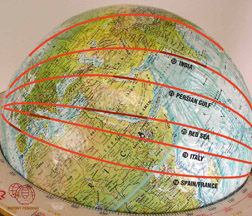
If we can find intersecting lines through Europe which is 120° or so away, we would have good confirmation of positioning at our Greenland and Australia points. Positioning of this nature is not explained by Plate Tectonics but can be explained by Expanding Earth.
 |
 |
|
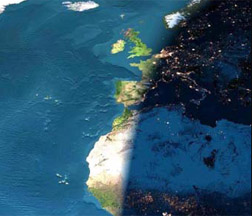
Fig. 3m Europe at night
|
Fig. 3n European Region
|
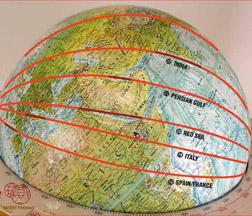
Fig. 3n is a beautiful satellite picture of Europe at night. Draw your attention to the Bay of Biscay between northern Spain and France. PT says they are being forced together. EE says they are being expanded apart. Notice the visible submerged tear between them. That is the 1000 Fathom curve which we will use. Dark Red lines are added in Fig. 3M at #18 Spain-France Bay, #19 Italy, Peninsula, # 20 The Red Sea and #21 the Persian Gulf. Then we will add #22 the West coast of India at the 1000 Fathom mark, and #23 Burma/Thailand. If you took a flat map of the region and drew straight lines through these positions, they would converge nowhere. But with Great Circles . . .
 |
 |
|
Fig. 3o European Connections
|
Fig. 3p Arabia
|
 |
|
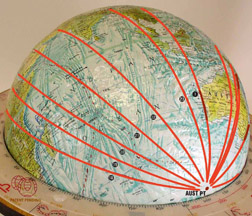
Fig. 3q Back to Australia Pt.
|
. . . Amazing. Key land Features GC’s converging on a few important points. Moved into position and having shapes altered by . . . an unknown force.
Not at all explainable by Plate Tectonics. More evidence of Earth Expansion.
 |
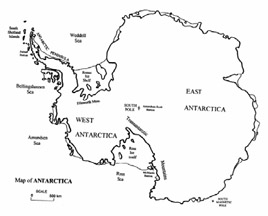 |
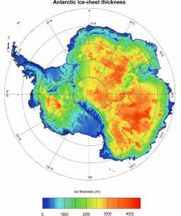
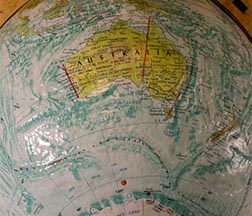
Most of us have not studied the shape of Antarctica. It’s hidden by most globe stands. These are two common presentations. Since all directions away from the South Pole are “North” it is hard to represent directions easily. Here 000°, or Greenwich, is to the top of the sheet. Perceptively it appears that the important peninsula of Antarctica points into the south pacific and is unattached to anything else. There is debate in the PT science community whether West and East Antarctica were always together or whether they randomly jammed into each other. A Great Circle perspective will make clear the probability that the Weddell and Ross seas opened up as Antarctica was pulled and expanded apart. It also shows the likelihood that the Antarctic Peninsula fits nicely back into the bight of the Weddell Sea.
 |
 |
|
Fig. 3r Antarctic Peninsula/Chilean Coast
|
Fig. 3s Antarctic Peninsula/Cape Horn
|
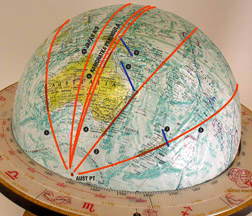
Fig. 3s shows how closely associated are the two peninsulas of Antarctica and South America. While it is possible the two peninsulas randomly met, it is more probable that they were always in close proximity and got stretched and extruded like taffy from the expansion forces. In Fig. 3r Dark Red lines are drawn on the Key Features of both the #24 Antarctic Peninsula and the long #25 Chilean Coast of South America. Great Circle lines show they connect to the Australia Pt.
 |
 |
|
Fig. 3t South America GCs
|
Fig. 3u Greenland Pt. Connection
|
Simply following these two Great Circle lines (in 3t, 3u) and rotating the globe to another position shows that these two new GC’s connect also to the Greenland Pt. A close inspection also shows that the red connecting line we made before between the South America Pt. and the Greenland Pt. – which ran through the #17 Caribbean Windward Islands – also runs through the #24 Antarctic Peninsula. Coincidence, or is there a powerful force directing these actions?
 |
|
Fig. 3v Americas Connection to South America Pt.
|
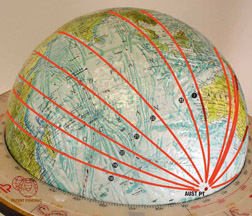
To further fix our South America Pt. we add # 26 the Nazca Coast of Peru, #27 the Gulf of California, #28 the 1000 Fathom West Coast of Florida, #29 Florida’s West Coast, #30 Hudson/James Bay, and #31 The Atlas Mts. in Morocco.
We have diligently found many more than two navigation points to fix all positions. Red connects Australia Pt. and Greenland Pt. Blue connects Taiwan Pt. and South America Pt.
 |
 |
|
Fig. 3w South American Pt. at 086°
|
Fig. 3x Taiwan Pt. at 094°
|
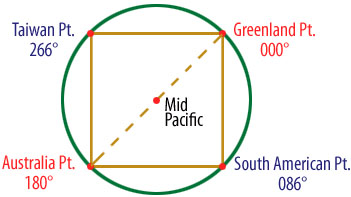
Four Points, on a Great Circle, ~90º Apart
Four Key Points have now been identified by multiple positions of Key Features of the Earth using Great Circle Intersections. They are the Australia Pt. and its antipode the Greenland Pt. and the Taiwan Pt. and its antipode the South American Pt. If we position these 4 points on the wooden ring we have a near exact Great Circle again. The separation between points is also incredible. If the Greenland Pt. is at 000° then the Australia Pt. is at 180° degrees. Where do the other two points align? The South America Pt. would be 086° away from the Greenland Pt, as shown. The Taiwan Pt. would be 094° (at 266°) away from the Greenland Pt, as shown. Being 090° away exactly would yield a circle with an inscribed four-sided square.
A wide angle view looking down on the Earth reveals the Four Key Points:
 |
|
Four Key Points
|
It should be obvious that something out of the ordinary – something that hasn’t previously been recognized nor taught – is going on here.
|
There is another Key Point to consider, a 5th point. It is located between South America and Africa, in the South Atlantic and just north of what’s called a “triple junction” point on the mid Atlantic ridge. It is the dark dot in the lower right of this picture. This point appears likely to have been one of the initial fracture points of the Earth, directing expansion forces. |
Pacific Hotspots – Additional Evidence:
|
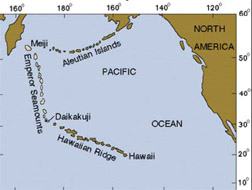
Out in the Pacific there is the familiar #13 Hawaiian Island Chain. These are a string of volcanic islands, which formed as the pacific plate moved over a “hotspot”. This is what PT teaches, and is looks true. There were earlier volcanic islands that have since eroded and are now beneath the ocean surface. These are the #32 Emperor Seamounts. Notice that both chains are consistently formed straight but with a midway bend. The bend is explained in PT as the plate shifted direction at that point. Science has age dated these islands as to when they erupted. We earlier drew a blue GC in Fig. 3h over the #13 Hawaiian Chain and connected it to the Taiwan Pt. and the South American Pt.
|
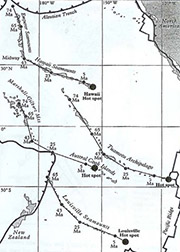
It turns out that there are 3 other significant hotspot island chains in the Pacific. They are rarely talked about. They are the Marshall Island-Austral Cook, Tuamotu, and Louisville Island Chains. All turn similarly and all are age dated.
|
To visualize them accurately we must plot them precisely on our 12″ globe using the flat map coordinates. Plate Tectonics teaches they are parallel and if the Pacific plate really moved as one piece they must be parallel. We know now that only small circles (not great circles) can be parallel on a globe. If lines drawn down these islands connect then we are dealing with Great Circles, which can’t be parallel, but can only appear parallel during part of their track. The volcanoes began 74 ma. 43 million years ago (ma) something happened to cause a direction change. It will be shown that GC green lines drawn from 74 to 43 ma connect to the South Atlantic Pt. Those GC blue lines drawn from 25 ma to present connect to the South America Pt. and also the Taiwan Pt.
|
It seems that the South Atlantic Pt. was a directing force initially. This capability apparently shifted to the South American Pt. Let’s first position this early point. The Replogle and Cram globes highlight different fathom features. Replogle uses 1000 fathoms and Cram 100 fathoms for coastal depths. We will now use the Cram globe that excels on the Marshall Island-Austral Cook and Tuamotu Chains. The Louisville Chain lies even deeper and is not easily visible on either globe.
|
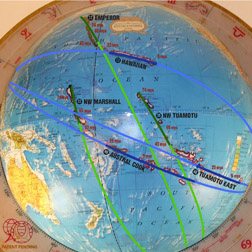
We will focus on the northern 3 chains. Light Green GC lines will be used to connect to the South Atlantic Pt. Light Blue GC lines will connect to the Taiwan and South America Pts. The islands are not perfectly straight and a case could be made for being near parallel, if additional connection position “fixes” had not been found. |
|
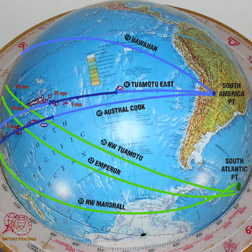
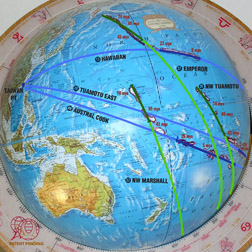
Fig. 3aa shows that converging GC lines going south from #32 the Emperor Chain, and #35 the NW Tuamotu Archipelago both connect to the South Atlantic Pt., and #33 the Marshall Chain and # 34 the Louisville Chain come very close. #13 the Hawaiian Chain, # 48 the Tuamotu Chain – East, and #49 the Austral Cook Chain – East all connect to the South America Pt. |
|
Fig. 3ab continues the light blue GC lines through island chains #13 Hawaiian, #48 Tuamotu, and #49 Austral Cook to the west to meet at the Taiwan Pt. on the Tropic of Cancer. The island chains path follow Great Circles, are not parallel, and these circles meet as expected at our Key Points. |
|
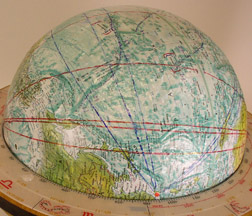
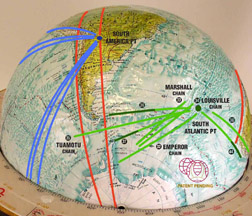
We will return to the Replogle Globe to use its 1000 fathom coast lines. In Fig. 3ac is drawn dark green lines through # 36 Cape Horn to St. George Island East by the South America peninsula and # 37 Antarctic Peninsula to South Orkney Islands. From the east direction we plot line #44 on the 1000 Fathom curve of Africa’s Cape Hope. Additional Earth Key Features will add more visibility to the South Atlantic Pt. The South Atlantic Pt. becomes more apparent. Can we verify it with additional plots? |
|
|
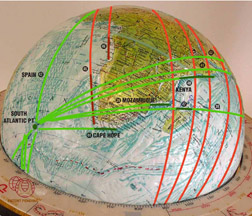
In Fig. 3ad #44 Cape Horn becomes clearly visible. We add #39 the Mozambique Coast and #40 the Kenya/Somalia Coast. #47 is the NW Coast of Madagascar. While out of the picture the West Coast of Spain is #43 in green and it too connects to the South Atlantic Pt. Two significant Coastlines of West Africa, #45 and #46 add to the red plots that connect to the Greenland Pt. (Australia Pt. also if it could be seen) |
|
Fig. 3ae starts putting the unusual Indian Ocean region in perspective. Dark Green lines #39 the Mozambique Coast and #40 Kenya/Somalia Coast are clearly visible. #41 the Coast of Oman is plotted. In both the Red Sea and Persian Gulf there are narrow straits. They show where pulling apart occurred and are marked as #42. Finally the sharply angulated SE Coast of India is marked as #38. Notice that the light green line through #38 goes exactly through the dark green line of #47 Madagascar also. |
The exact position of the South Atlantic Pt. is:
43° South Latitude 14° West Longitude.
What happened between 43 and 25 Million Years Ago (ma)?
The hotspot tracks of our 4 island chains show that from 74 ma to 43 ma the great circles drawn connect in straight lines to the South Atlantic Pt. From 25 ma to the present the Hawaiian, Tuamotu, and Austral Cook chains connect by GC’s to the Taiwan and South America Pts. What happened in between? Plotted on a sphere we get a wide arc between 43 and 25 ma. By taking small segments of this arc at a time would show that the drawn GC’s would connect by moving north from the South Atlantic Pt. up the Mid- Atlantic ridge, and then northwest to the South America Pt. This is evidence that the expansion force shifted during this time.
The Great Circle expansion information presented above can add insights and clarity to previous small earth reconstructions. That will be presented in the future.
However, the different graphics of the Earth show Great Circle Lines expanding from the five Key Points. In many ways, the analogy can be made to the expansion of an accordion. As the major ribs of the expanding accordion cannot be compressed back beyond a previous rib, it is likely that no expansion great circle will compress back over another expansion ″rib″.
|
|
 |
|
Accordion like expansion ribs may dictate a reconstruction rule.
|
|
MACO–SPIRE
Magnetic Core — Solar Plane Induced Reactive Expansion
Our four Key Points, now apparently directing expansion, provide clues to the cause of expansion. For simplicity we have designated this as MACO – SPIRE. It is based on the belief that mass is being gained or created within the magnetic core or the core mantle interface. Here is the evidence for that assumption.
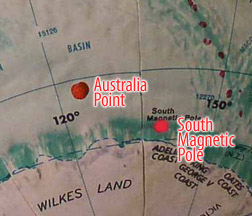
A close up of the well-identified Australia Pt. shows how close it is to the South Magnetic Pole. This is not thought to be a coincidence.
 |
 |
|
Australia Pt. … is …
|
… Close to South Magnetic Pole
|
 |
|
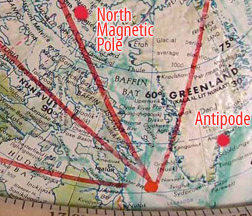
North Magnetic Pole, Greenland Pt. and South Magnetic Pole – ANTIPODE
|
When we plot the antipode of the South Magnetic Pole we would expect it to be in the position of the current North Magnetic Pole. Yet it is not. The antipode is very close to the Greenland Pt.
Apparently, there is a magnetic core shaft in the earth that points very near to our two key points, but that the magnetically measured pole locations on the earth’s surface moves substantially — and not in perfect harmony — over time.
| When an irregular shaped solar system object grows larger over time, at some point it gets spherical. L. Myers has shown that bodies become spherical at about a diameter of 400 miles. At this point the gravitational forces focus into the core. |
|
|
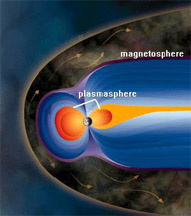
At some later time some, but not all bodies, attain a magnetic core, with electro-magnetic energy. S. Carey suggests this occurs at a diameter of ~2000 Miles. Earth has such a core. Electro-magnetic energy is much more powerful than gravitational force. As the picture shows the earth’s protective magnetosphere has a shape dictated by the location of the North and South Magnetic Poles. While not proof, the location of the key points of Australia and Greenland being so near these poles is strong evidence of an electro-magnetic link. |
What can be derived from the location of the Key Points of Taiwan and South America? Both are located 23.5° north or south of the Equator. They are located on the Tropic of Cancer and the Tropic of Capricorn. This is the exact tilt angle of the Earth to the solar plane. What is this significance? Between 23.5° North Latitude and 23.5° South Latitude the Sun travels its highest elevation in the sky. Between those two latitudes the sun is always perpendicular to the Earth’s surface. The earth is likely being effected the strongest when and where the sun’s energy is perpendicular. If the sun is emitting unknown particles or energy and if the earth’s core is the capture and receptor of those expansion inducers then a perpendicular angle would likely be the most successful.
However, there is nothing but assumption to say the Sun is emitting the necessary particles or energy. What has been shown is that there are two Key Points on the solar plane and that there is likely an influence from the solar plane. Therefore, there could just as well be energy, particles, or other unknown forces being attracted to the sun from on the solar plane and also being captured at the earth’s core. The studies of Aether would point more in this opposite direction. The correlation between the solar plane and the two key points near the equator is as apparent as is the correlation with the magnetic core. What is captured and how that leads to expansion is certainly not yet clear, but evidence for a new path for exploration and research has been developed.
Since a magnet has both an attractive and repulsive force the observer can view the numerous graphics and determine which may be which. My observations would indicate that the Australia Pt. is an attractive force and the Greenland Pt. is a repelling force. A study of the Earth surface graphics indicates that not only have some continental bodies been moved, they have also been significantly reshaped due to these forces. This observation will alter and add to the previous fine work done on small earth reconstructions.
There is evidence that other spherical bodies in our solar system are expanding. There is still so much to learn that no general overriding theory need now be made. These observations indicate that the Earth is Expanding and that its magnetic core is a significant influence. Is the Earth Expanding? Which other spherical solar system bodies may be gaining mass and expanding? Is having an active magnetic core a necessity for expansion? Is mass gain consistent and continual, or does it occur episodically, in “ebb and flow” fashion? These questions are all answerable but it requires the focused effort of researchers using the open-minded scientific method.
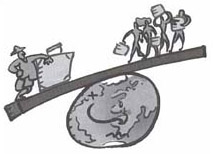
Which unbelievable story is easier for you to believe?
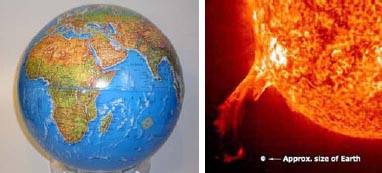
The first story is the Expanding Earth. This story uses the size of our solar system scale model presented in the 12″ Earth section. Here a 6″ Hoberman sphere is 2 miles away from a 110-foot tall blazing sun sphere. For billions of years that blazing sun bombards the small earth with massive amounts of particles and energy and in the last 250 million years the sphere doubles its diameter to 12 inches. Is this so unbelievable??
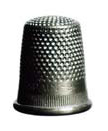
The second story is the Big Bang theory and Physics beliefs that mass cannot ever be created. (A common sense understanding of the Big Bang Theory can be found in the Articles Section. To read The Big Bang Theory Lacks Common Sense, click here.) In this story the Earth and the sun compress back into a thimble 13.7 Billion years ago. Our sun is so big it can hold 1.3 million earths, but it is small compared to most suns. Into that thimble must compress our galaxy also with its 200 Billion other stars and star systems. Into that thimble must also go all of the other galaxies in the universe. How many is that? With 6 Billion people on the Earth there are enough for 20 Galaxies per person, each with 200 Billion star systems. That’s 4 trillion star systems for each person. Once we’ve fit all those galaxies into the thimble we find we have only found 5% of the needed matter to make the Big Bang story work.
Since we have easily accepted Story #2, is it so hard to re-consider . . . unbelievable Story #1? What do you think?
 |
 |
|
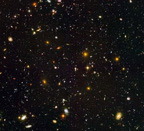
HDFN Hubble Deep Field North
|
The earth has expanded. It has about doubled its radius in the last 250 million years. It is now expanding about 1″ in radius per year and that rate is increasing exponentially. Mass is being gained. Gravity 250 million years ago was about 50% of today’s. The continental landmasses fit back nicely together on a smaller sphere. There were no oceans between the continents. There were no oceans, only shallow seas that covered much of the land. (Marine fossils of that time have been found on the land; not in the oceans.) The atmospheric pressure was likely much greater (aka, Venus). Oxygen content was less. Mass was gained in the core and grew and expanded out the mantle and crust. New minerals were produced. Natural gas and liquid petroleum were produced. The developing atmosphere outgassed from the interior. The water was created and outgassed and oozed from the interior. Insects, plants and animals evolved robustly to fill the available niches. They grew to gigantic size as low gravity and atmosphere will allow. As mass was gained, gravity increased, the atmosphere changed and large living things went extinct and were replaced by continually adapting smaller living things. Major earthquakes and super volcanoes and incredibly large lava flows catastrophically occurred as the crust readjusted to new pressures. And the cycle continues.
Likely the whole Universe, in some way, is expanding and creating new mass over time, and if we fit back into a thimble 13.7 Billion years ago, there wasn’t as much mass and matter then, as there is now.
I have become a believer in Earth Expansion for numerous reasons. I have attempted to describe some of these reasons to influence the reader to study further. Overturning or even getting a fair hearing versus Plate Tectonics and the Physics theories which supports it has been shown to be a near impossible task. Let us consider then that Earth Expansion with mass gain is the second best theory that fits the known facts. There is likely also a third best theory. Let’s re-explore these alternatives. Let’s actually do the experiments and not rest on old assumptions and untested hypothesis.
The best experiment you or scientists can now do is to draw great circles on an earth sphere and replicate the four dozen identified features. You will find others on your own.